Supervised and unsupervised technical analysis 2020-2021
Used supervised and unsupervised learning to build a robust labeling system that was used to enhance an AI based trading strategy (while also increasing explainability)
Technical Analysts use charts to make decisions about the stock market. I decided to research how well chart patterns predict future prices
My prior experience studying Finance and Accounting, as well as working briefly at both an Investment Bank and Hedge Fund. The I-bank provided buy-side advisory services to private equity firms, and the Hedge Fund had a long-only policy. Also, in college I worked at Merril Lynch and UBS, so I have seen first hand several different approaches to valuing financial assets. Obviously, with a long-only strategy, the goal is to find "under valued" assets and to buy them. Presumably, if the market "over values" the assets after you purchased them...you should sell them.
Qualitative analysis looks at the underlying qualities of a company.
Technical analysis looks at chart patterns and derived analytical tools (such as moving averages, volatility patterns, volume spikes, etc...)
Qualitative Analysts (like Warren Buffet) typically dismiss technical analysis. Technical Analysts swear by their techniques though successful strategies are rarely shared publicly
The Hedge Fund that I worked at did a combination of Technical and Qualitative analysis, and generally required that both approaches confirmed their investment hypothesises. The firm was successful, the assets under management grew from about $2 billion to $4 bilion in the brief time that I was there, and their investment strategies worked well.
...and now onto the research!
- Moving Averages
- Moving Average Convergance & Divergence (MACD)
- Parabolic Stop and Reverse (SAR)
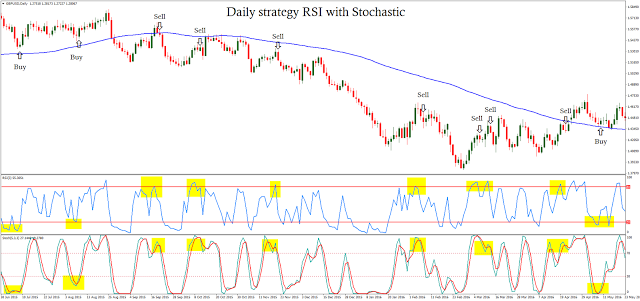
- Stochastic Oscillator
- Relative Strength Index (RSI)
- Commodity Channel Index (RSI)
- Average Directional Index (ADX)
- Standard deviation
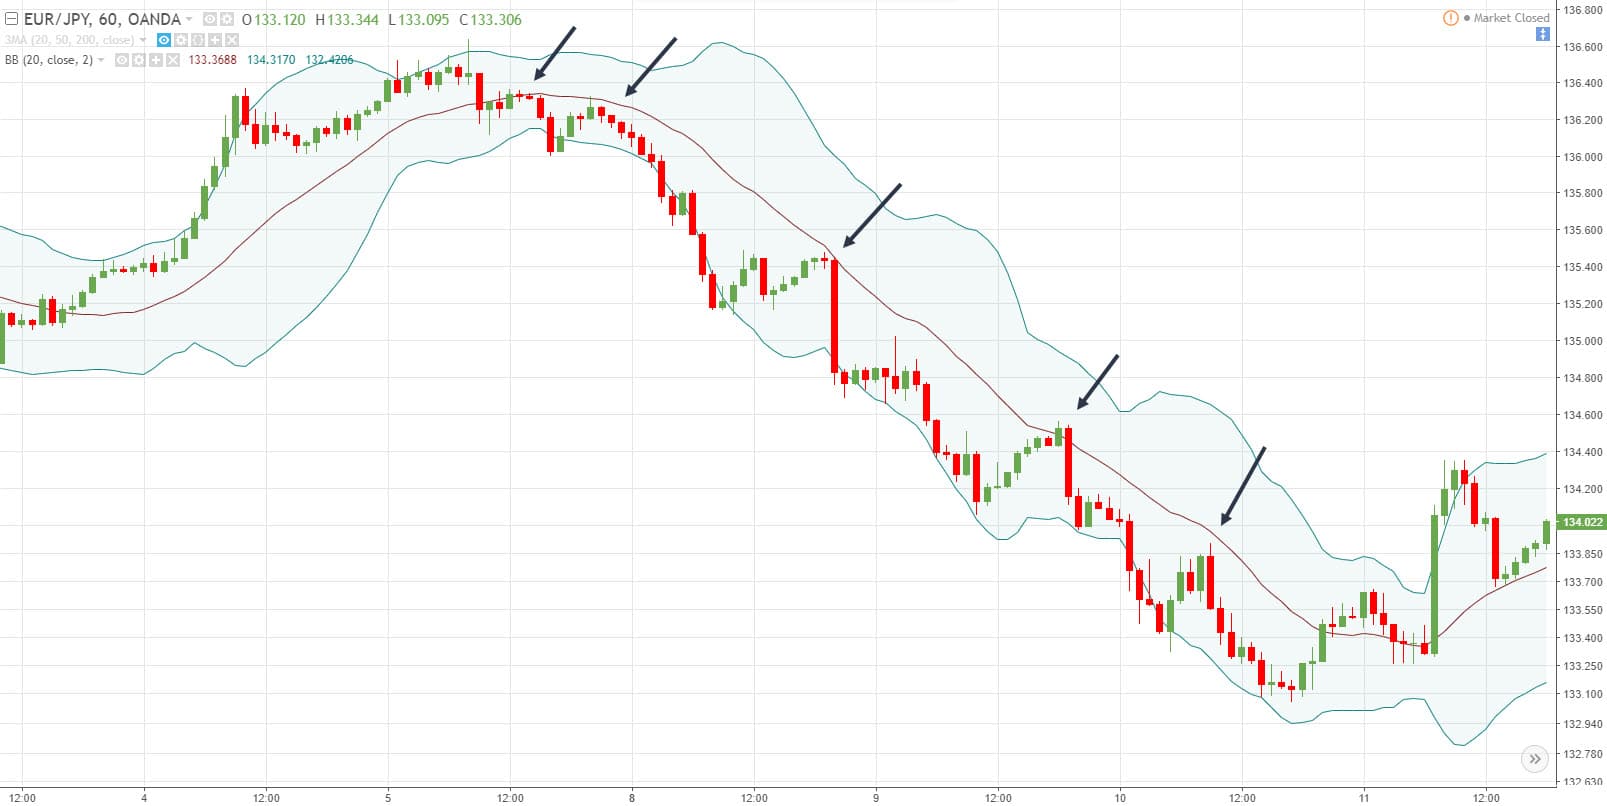
- Bollinger bands
- Average True Range
- Volume Rate of Change
- Chaikin Oscillator
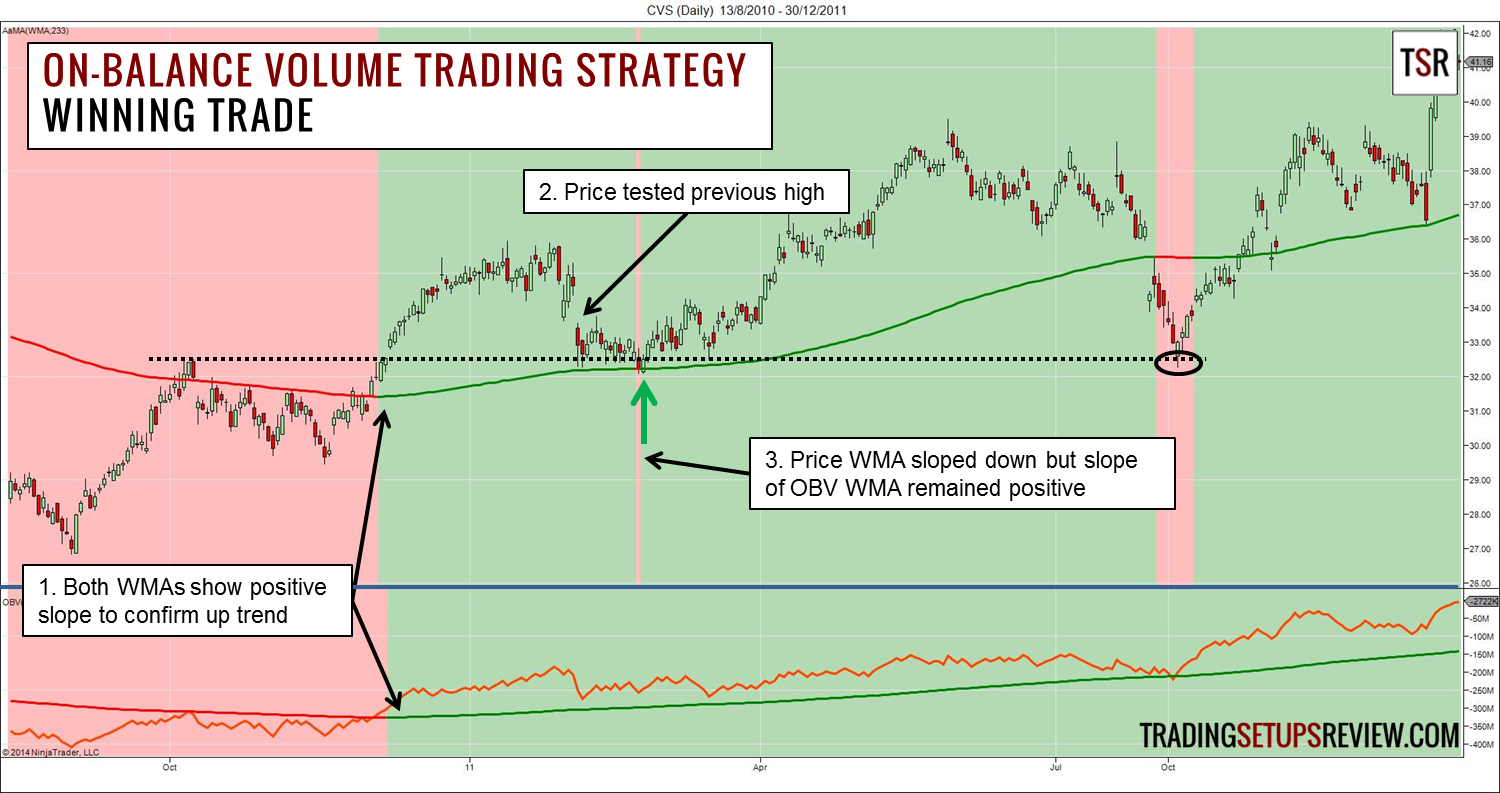
- On Balance Volume (OBV)
- Accumulation/Distribution (A/D) Line
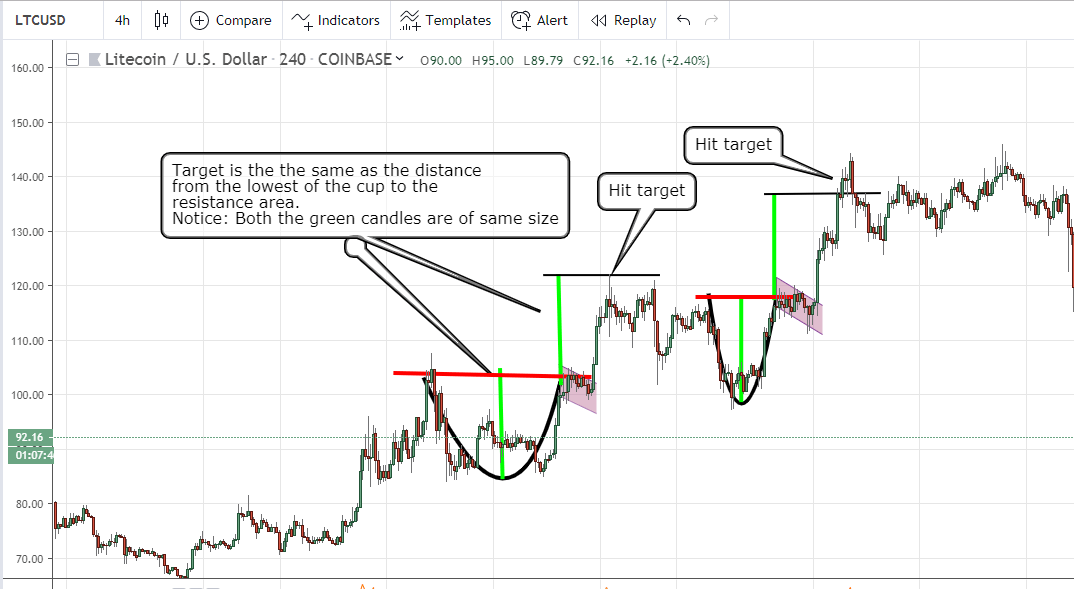
Plus chart patterns are analyzed for indications of break-up, break-down or expected sideways movement:
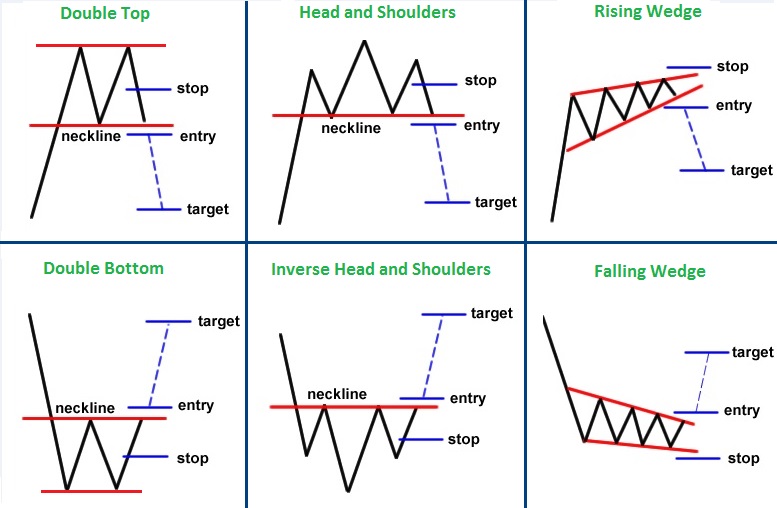
Common Strategies:
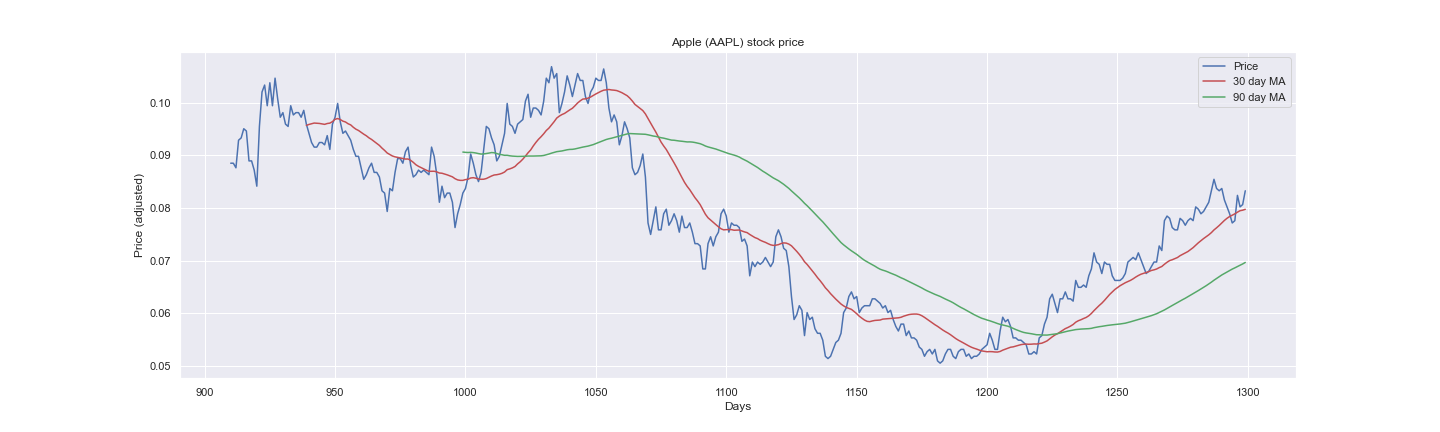
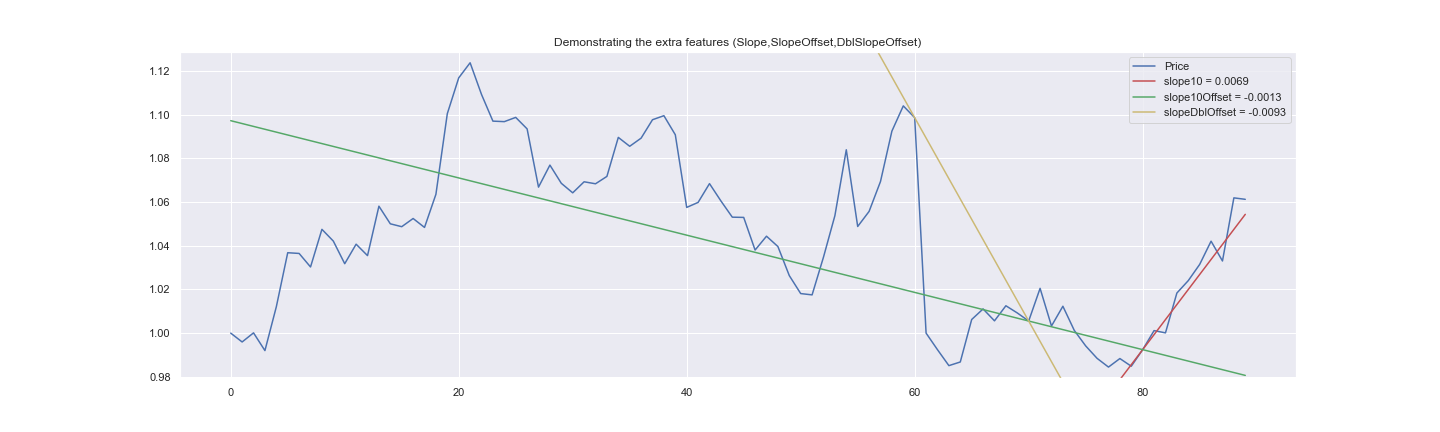
Many years ago I hand coded "trade signals" such as "when the 30 day Moving Average (MA) crosses the 90 day MA" (as shown in the image below)
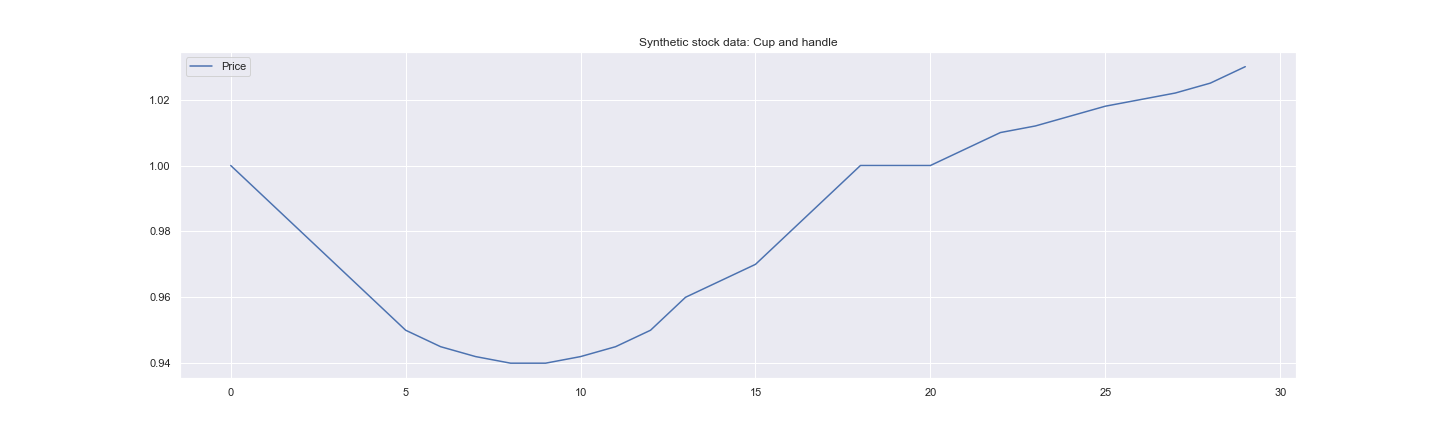
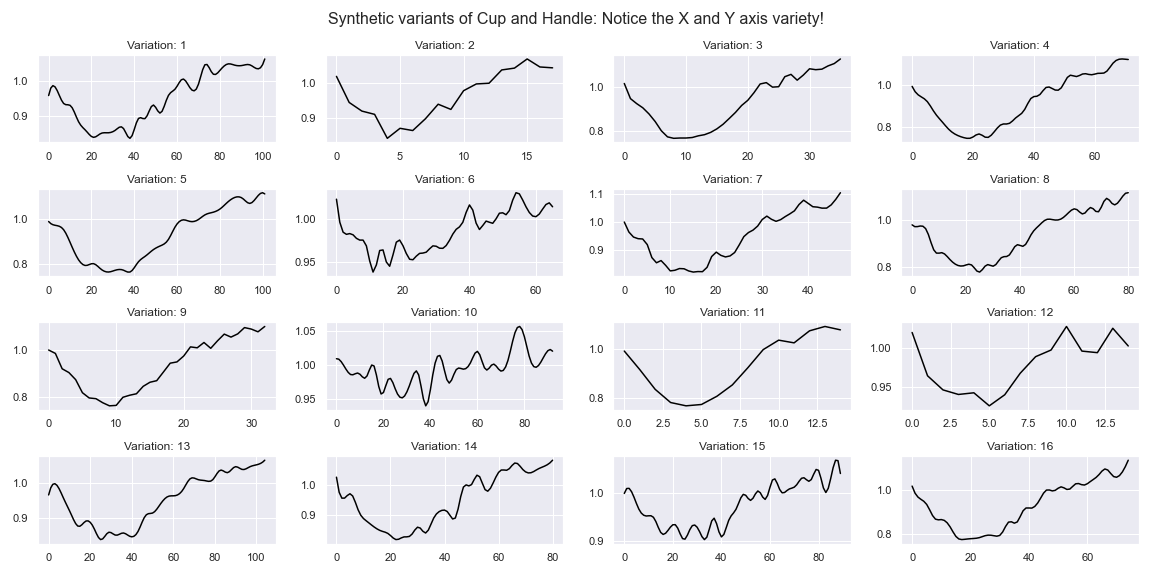
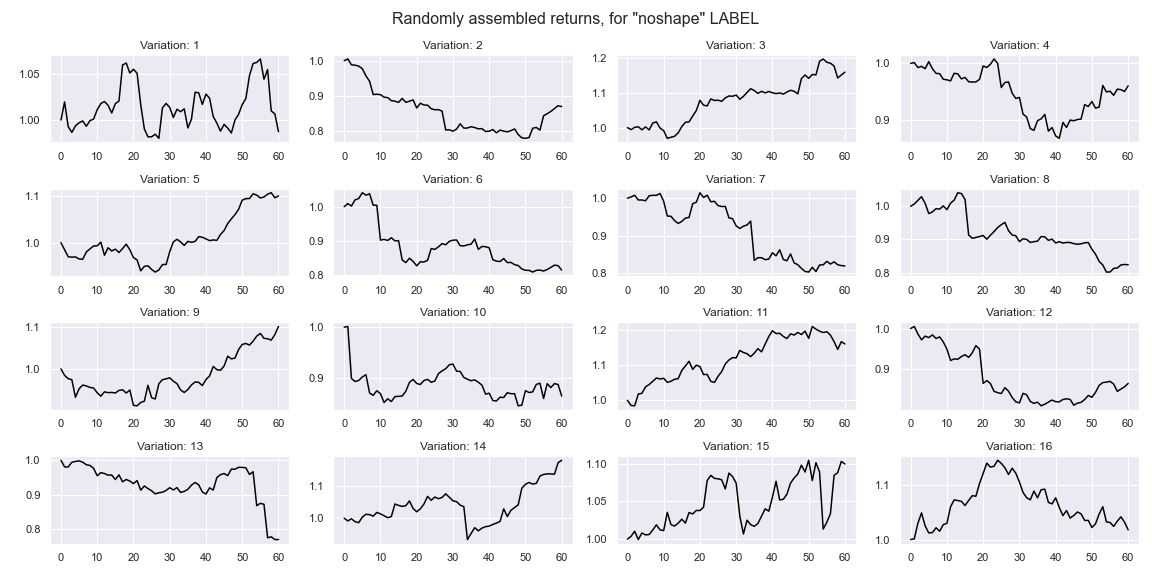
"Synthetic data" is artificially created information that can be used to TRAIN a neural network. For example: I want to teach a neural network to recognize basic chart patterns. To do so, I could 1) manually label actual charts, or 2) generate chart data from basic templates

A boutique consultancy focused on innovative technology driven solutions and the development of efficiency generating automation using generative AI, software systems and business process refinement.
Contact Us
110 E Valencia Mesa Dr Fullerton, CA 92835 US
team@meritocracyconsulting.com
(949) 732-0095